Do you know why your visitor numbers moved — and how many are coming next?
VisitorCast explains what drives your museum's attendance, keeps your key numbers current, and forecasts the weeks and months ahead — and proves its accuracy on your museum's own data.
It works with what you already have: upload daily visitor numbers from your ticketing system as a simple CSV — no hardware, no integrations, no new ticketing system. VisitorCast combines your numbers with built-in drivers — season, weekday patterns, public holidays, school vacations, paydays, weather, and your own exhibitions and events — so every figure comes with an explanation your whole team can follow.
Museums are asked to explain numbers they can't see
Every museum gets the same three questions. Why was this year — or this exhibition — better than the last? Are we on track right now? And what should we plan and budget for? Visitor numbers sit behind all of them, and behind staffing, marketing, exhibitions, events, retail, café and the visitor experience itself. Yet most museums still answer with spreadsheets assembled by hand, intuition, and last year's figures.
Enterprise analytics platforms exist, but they are built for theme parks and large institutions with data teams and budgets to match. VisitorCast takes a different path — smarter than the spreadsheet, simpler than enterprise analytics: transparent analysis and forecasts, built only for museums, made for the way museum teams actually work.
Explaining the museum after the fact
Without analysis you can trust, the story of the year gets written from memory — and the same figures are rebuilt by hand before every meeting.
- Nobody can say why visitor numbers rose or fell
- It's hard to tell whether an exhibition performed well, or just opened in a busy month
- The board report is reassembled from ticketing exports the night before
- Different people in the museum quote different numbers
- Staffing and marketing get planned on averages and gut feeling
A museum that can explain itself
VisitorCast shows what happened and why, keeps the current picture up to date, and projects what is coming — so decisions and board conversations start from evidence.
- See which drivers move your numbers: season, school vacations, weather, exhibitions, and more
- Compare any two periods and see what explains the difference
- Judge exhibitions on season-adjusted uplift, not raw visitor counts
- Open one report with your key figures already current, before the management meeting
- Forecast visitor numbers for the coming weeks and months
- Test the accuracy on your own history before you rely on it — and follow a live track record after
Built for the questions museums actually get asked
VisitorCast turns your own attendance history into answers — first about what already happened, then about what comes next. Many museums start with the analysis alone; the forecast earns its place from there.
Explain why the numbers moved
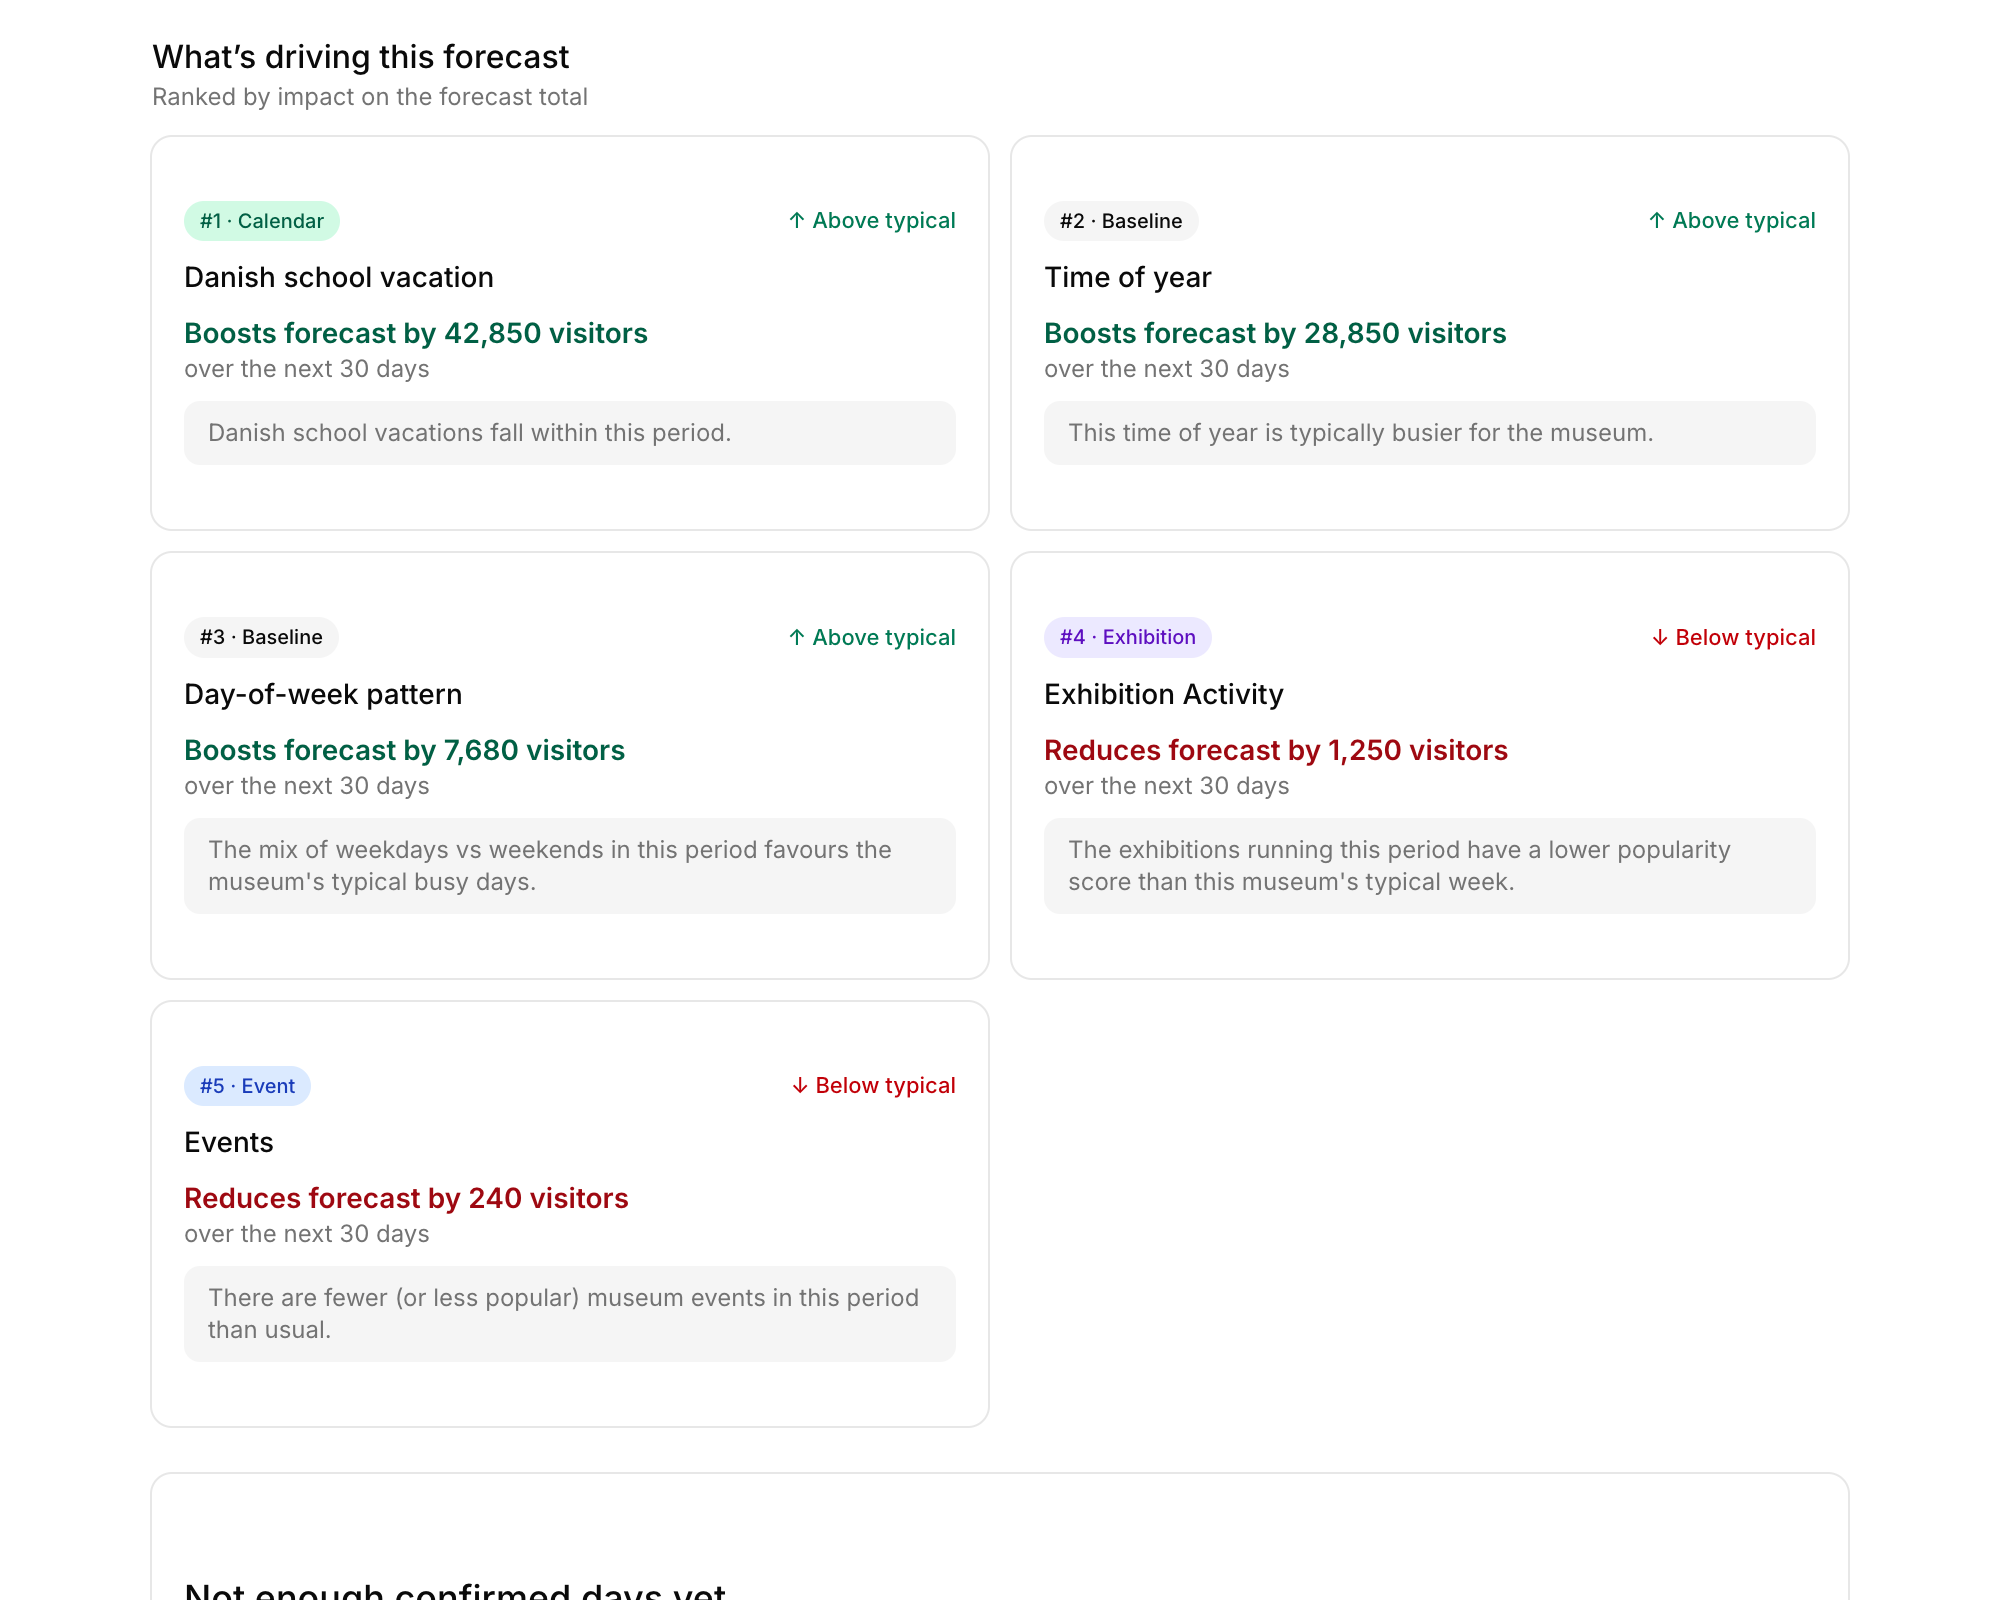
Season, school vacations, weather, holidays, paydays, your own exhibitions and events — VisitorCast analyses your history and shows which drivers move your attendance, and by how much.
Judge exhibitions fairly
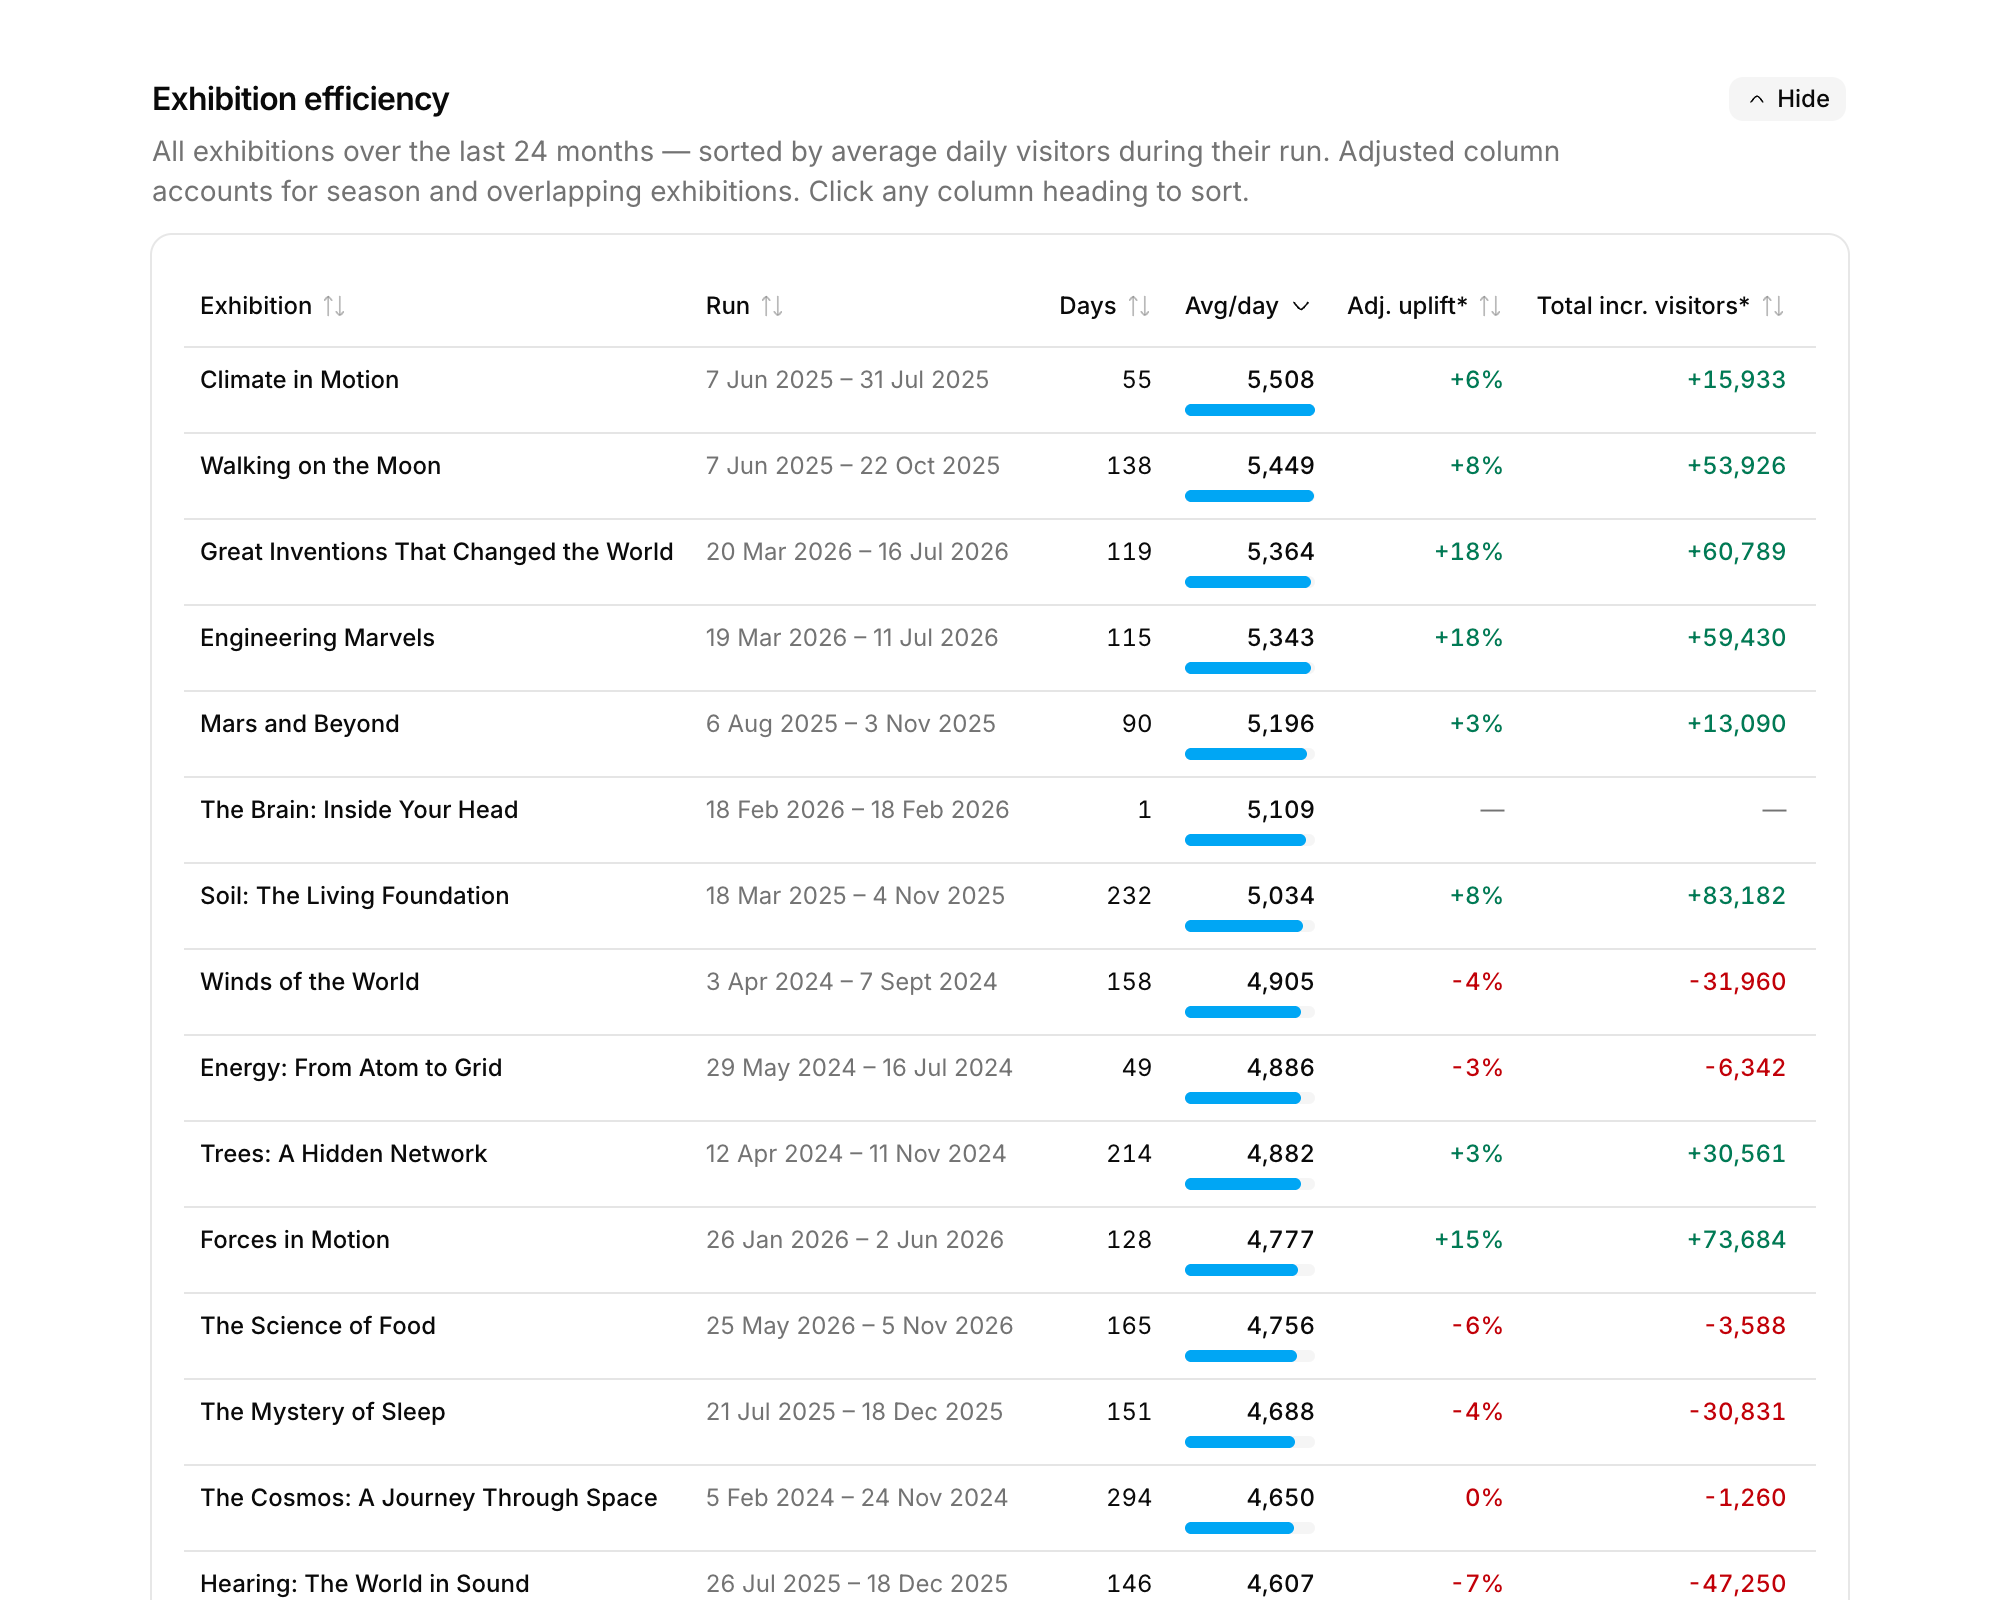
Compare exhibitions on season-adjusted uplift rather than raw visitor counts, so a show that opened in a quiet month gets an honest assessment — and the next programming decision is grounded in what actually worked.
Compare any two periods
This July against last July, one exhibition's run against another. See what explains the difference driver by driver: exhibitions, weather, weekday mix, season, and the museum's own underlying direction.
Report without the spreadsheet evening
The Insights report keeps your key figures, year-over-year comparisons and driver analysis always current — the numbers most museums still assemble by hand before every management and board meeting.
Plan staffing with confidence
Know when to expect busy days, quiet periods and seasonal peaks, so you schedule the right people at the right time, from front-of-house to café.
Time your marketing where it counts
See when demand will already be strong and when it needs a push. Spend your marketing budget lifting quiet periods instead of promoting days that would have been busy anyway.
One model. The past and the future.
The model that explains your history is the same one that projects it forward. VisitorCast learns the patterns in your museum's own data — weekly rhythms, seasons, holidays, school vacations and exhibitions — and every number it produces, historical or forecast, comes with its drivers ranked by impact: how much each one adds to, or subtracts from, the total. It is fully deterministic, so the same data always produces the same result: consistent, explainable, and never a black box.
How VisitorCast works
From the CSV you already have to answers your team can act on — in five steps.
Upload your visitor history
Start with the data you already have: daily visitor numbers from your ticketing system, as a simple CSV. VisitorCast validates the data and shows you exactly what it received.
Add your exhibitions and events
Register past and upcoming exhibitions and events. VisitorCast weighs them by popularity and learns their effect on attendance — including the extra draw of opening and closing weeks.
VisitorCast adds the built-in drivers
Your data is combined with drivers VisitorCast maintains for you: seasonal patterns, weekday rhythms, public holidays, school vacations, paydays, and weather. More drivers are added over time.
See what happened — and why
VisitorCast analyses which drivers actually move your attendance and quantifies each one, then assembles your Insights report: key figures, year-over-year comparisons, seasonality, exhibition performance, and period comparisons. This is where most museums get their first surprise.
Forecast the weeks ahead — and check the accuracy
Forecast your daily visitor numbers for the next week, month or quarter. Then run an accuracy check against your own history to see how well VisitorCast predicts your museum. Once you plan with it, a live track record shows every forecast next to what actually happened.
What VisitorCast does — past, present and future
Three parts, one model: analyse what already happened, see where you are now, and forecast what is coming.
Analyse · Insights report
Year-over-year comparisons, seasonality by month and weekday, a calendar heat map of your attendance, driver impact, and exhibition and event performance — with plain-language takeaways your whole team can act on.
Analyse · Driver analysis
See how much season, weekdays, holidays, school vacations, paydays, weather, exhibitions and events each contribute to your attendance — with recommendations for which drivers fit your museum.
Analyse · Period comparison
Compare any two periods and see what explains the difference: how much came from exhibitions, weather, the weekday mix, the season, or the museum's own underlying direction. Association, not causation — and honest about which is which.
Analyse · Trend analysis
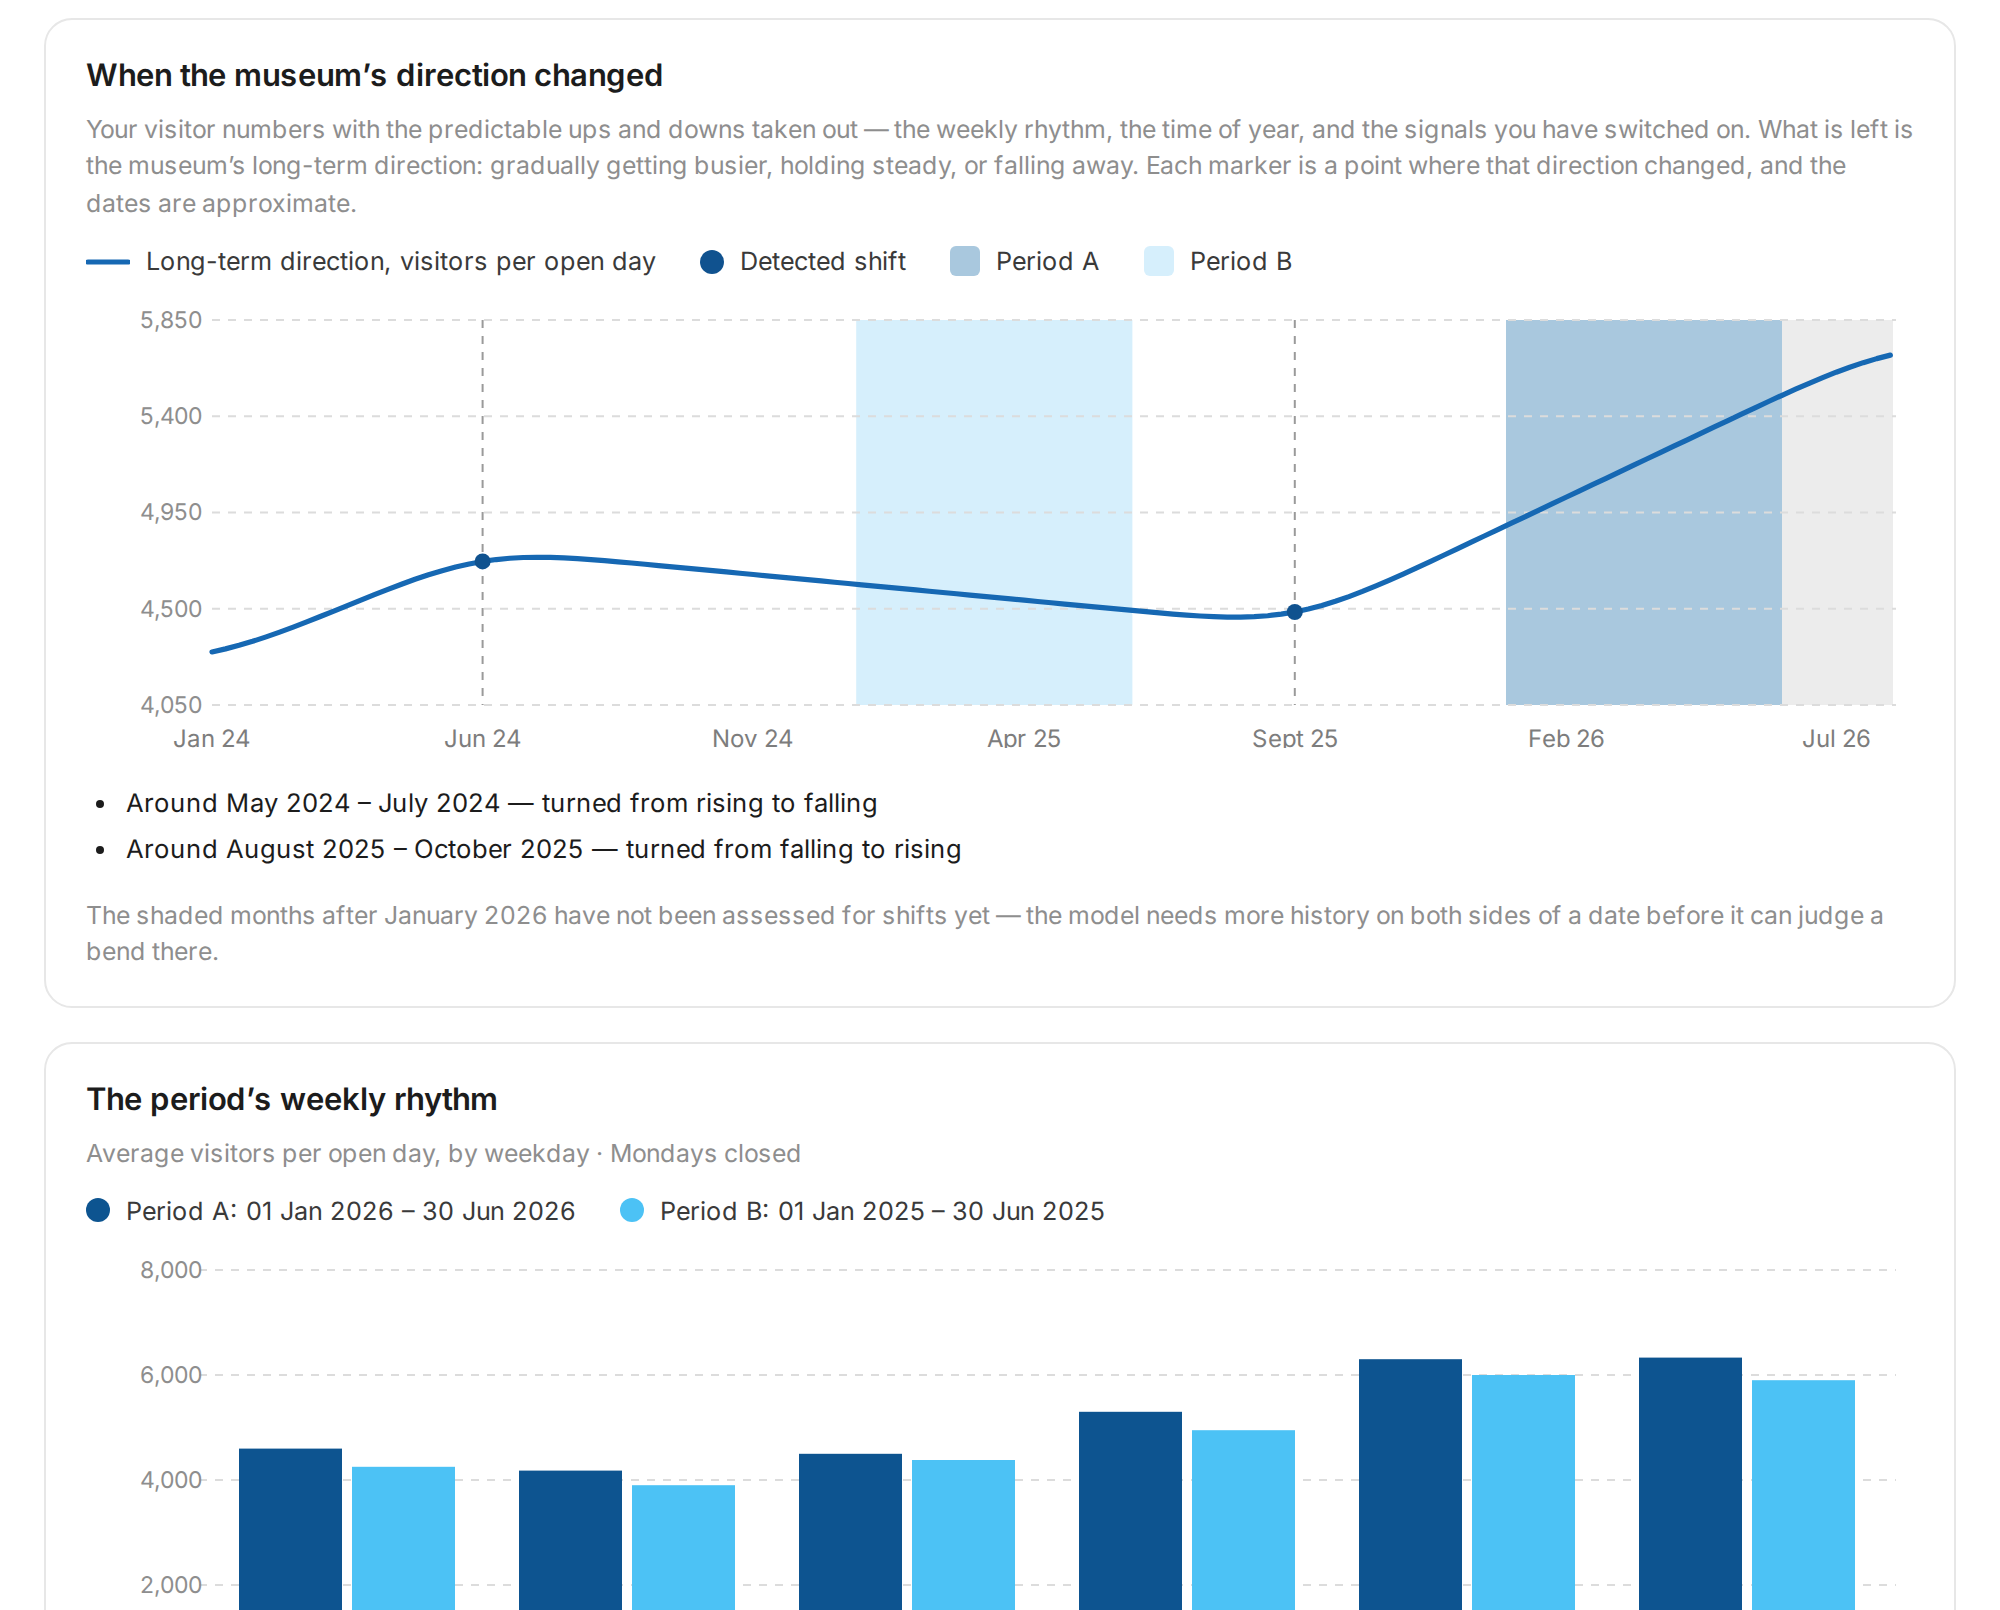
Your visitor numbers with the predictable ups and downs taken out — the weekly rhythm, the season, holidays, and your exhibitions. What remains is the museum's long-term direction: gradually getting busier, holding steady, or falling away — with a marker at each point where that direction changed, so you can ask what happened around that date. Dates are approximate, and VisitorCast says so.
Dashboard · Your key numbers, always current
Attendance to date, how it compares with last year, and how the current period is developing — in one place the whole team can open, instead of a figure someone recalculates before each meeting. Shared goals and budget targets are what we are building next; today the dashboard shows status, not targets.
Forecast · Visitor numbers, checked against reality
Machine-learning forecasts of your daily visitors for the next 7, 30 or 90 days — short enough for staffing rosters, long enough for seasonal and budget planning, with closed days handled automatically. Test them on your own history before you rely on them, then follow a live track record of forecast versus actual.
From your history to your next quarter
The Insights report gives you a complete, always-current picture of your attendance — the numbers most museums assemble by hand from ticketing exports, spreadsheets and status reports. Open it before the management meeting and the analysis is already done. From there the same model looks forward, and lets you check its accuracy on your own data before you rely on it. Especially valuable for small and medium-sized museums without an analytics team.
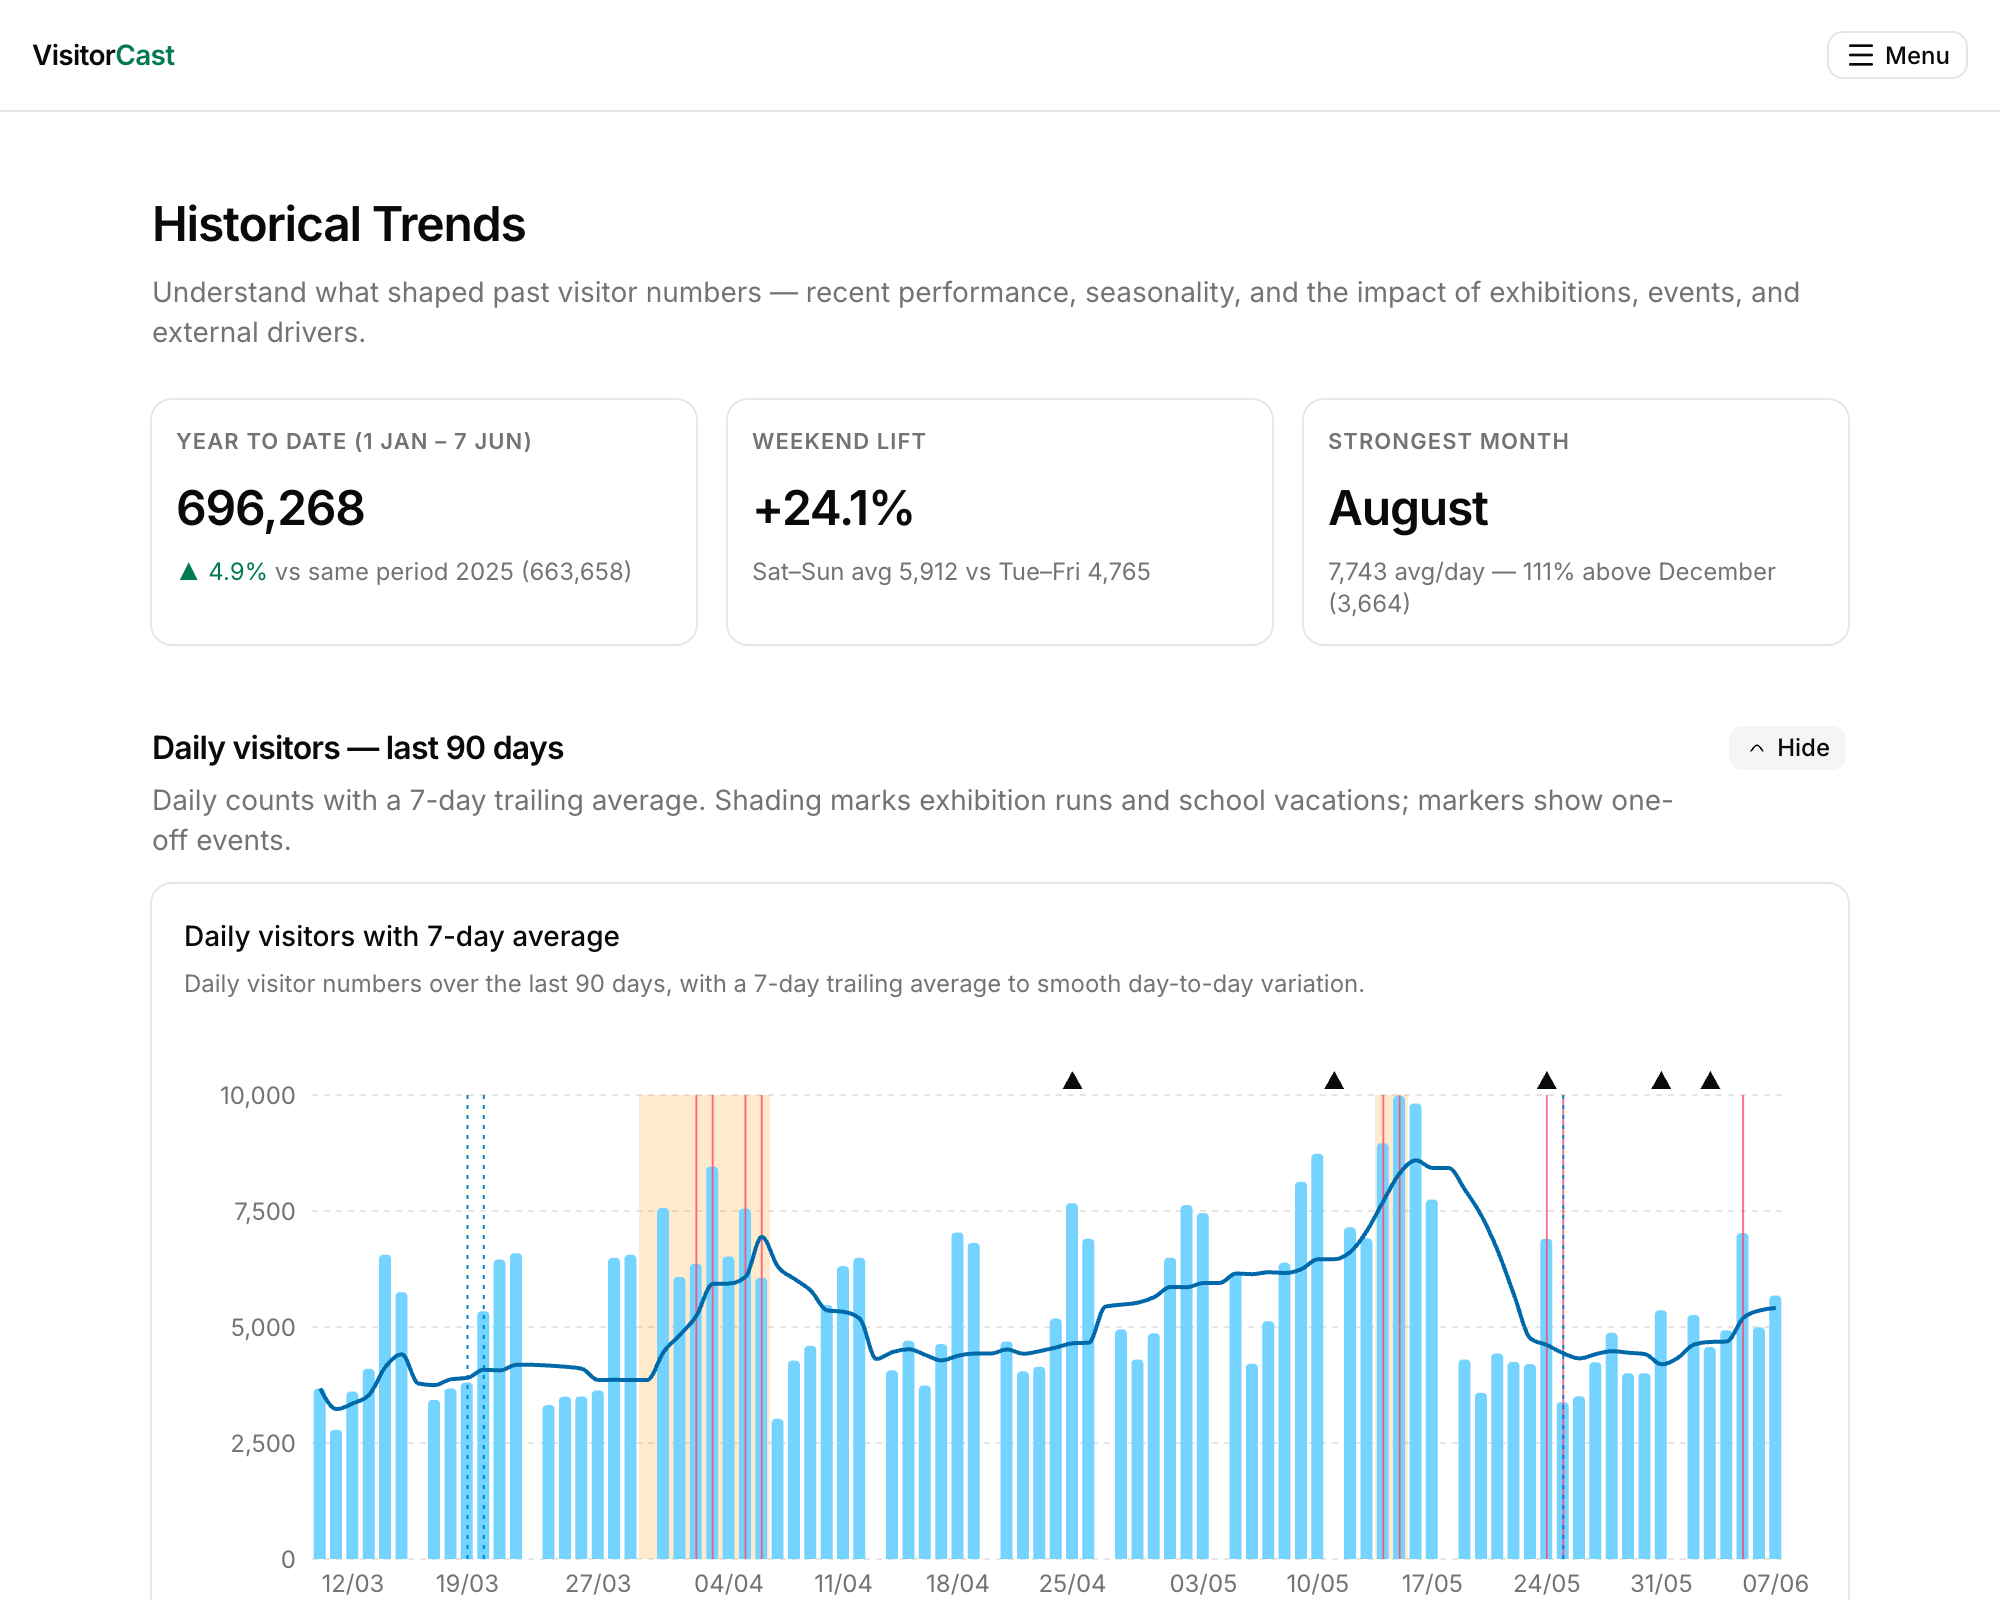
Key figures at a glance
Your headline attendance numbers, always up to date — no more compiling figures the night before the board meeting.
Daily visitors, last 90 days
See exactly how the recent period developed, day by day, and spot shifts early.
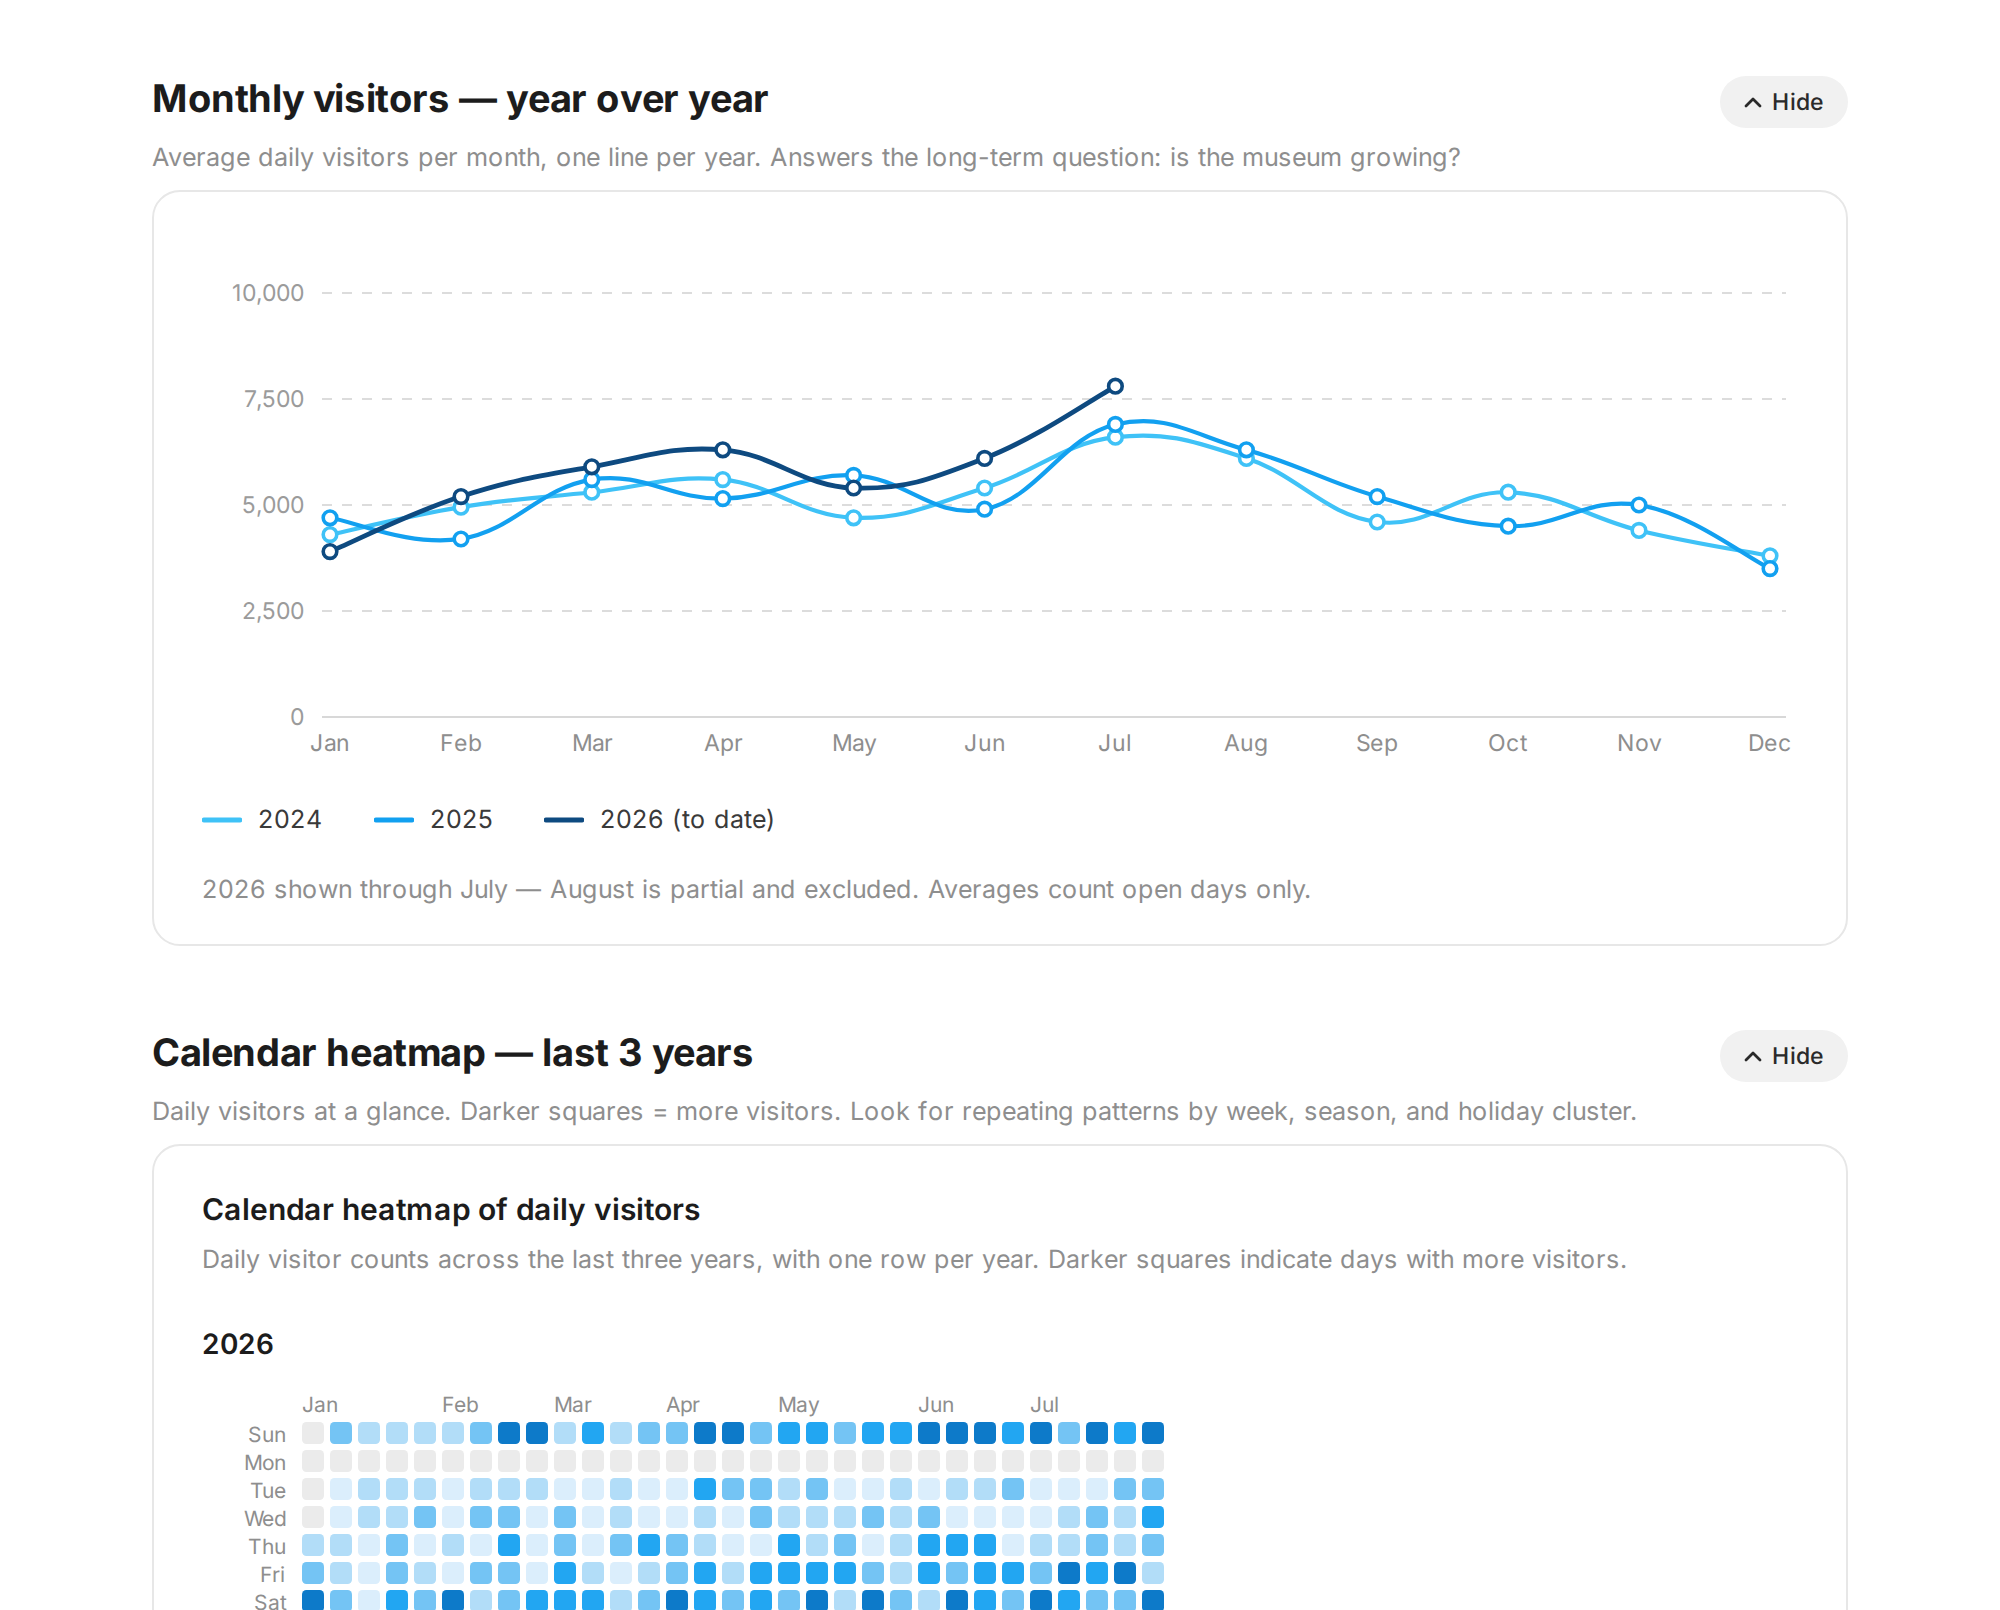
Monthly visitors, year by year
Compare each month against previous years to see whether you're ahead or behind — and by how much.
Calendar heat map
Your whole year, day by day, coloured by attendance. Busy weekends, quiet Mondays, and vacation peaks stand out instantly.
Seasonality by month and weekday
Know your busiest months and strongest weekdays — the foundation for staffing plans, opening hours, and programme scheduling.
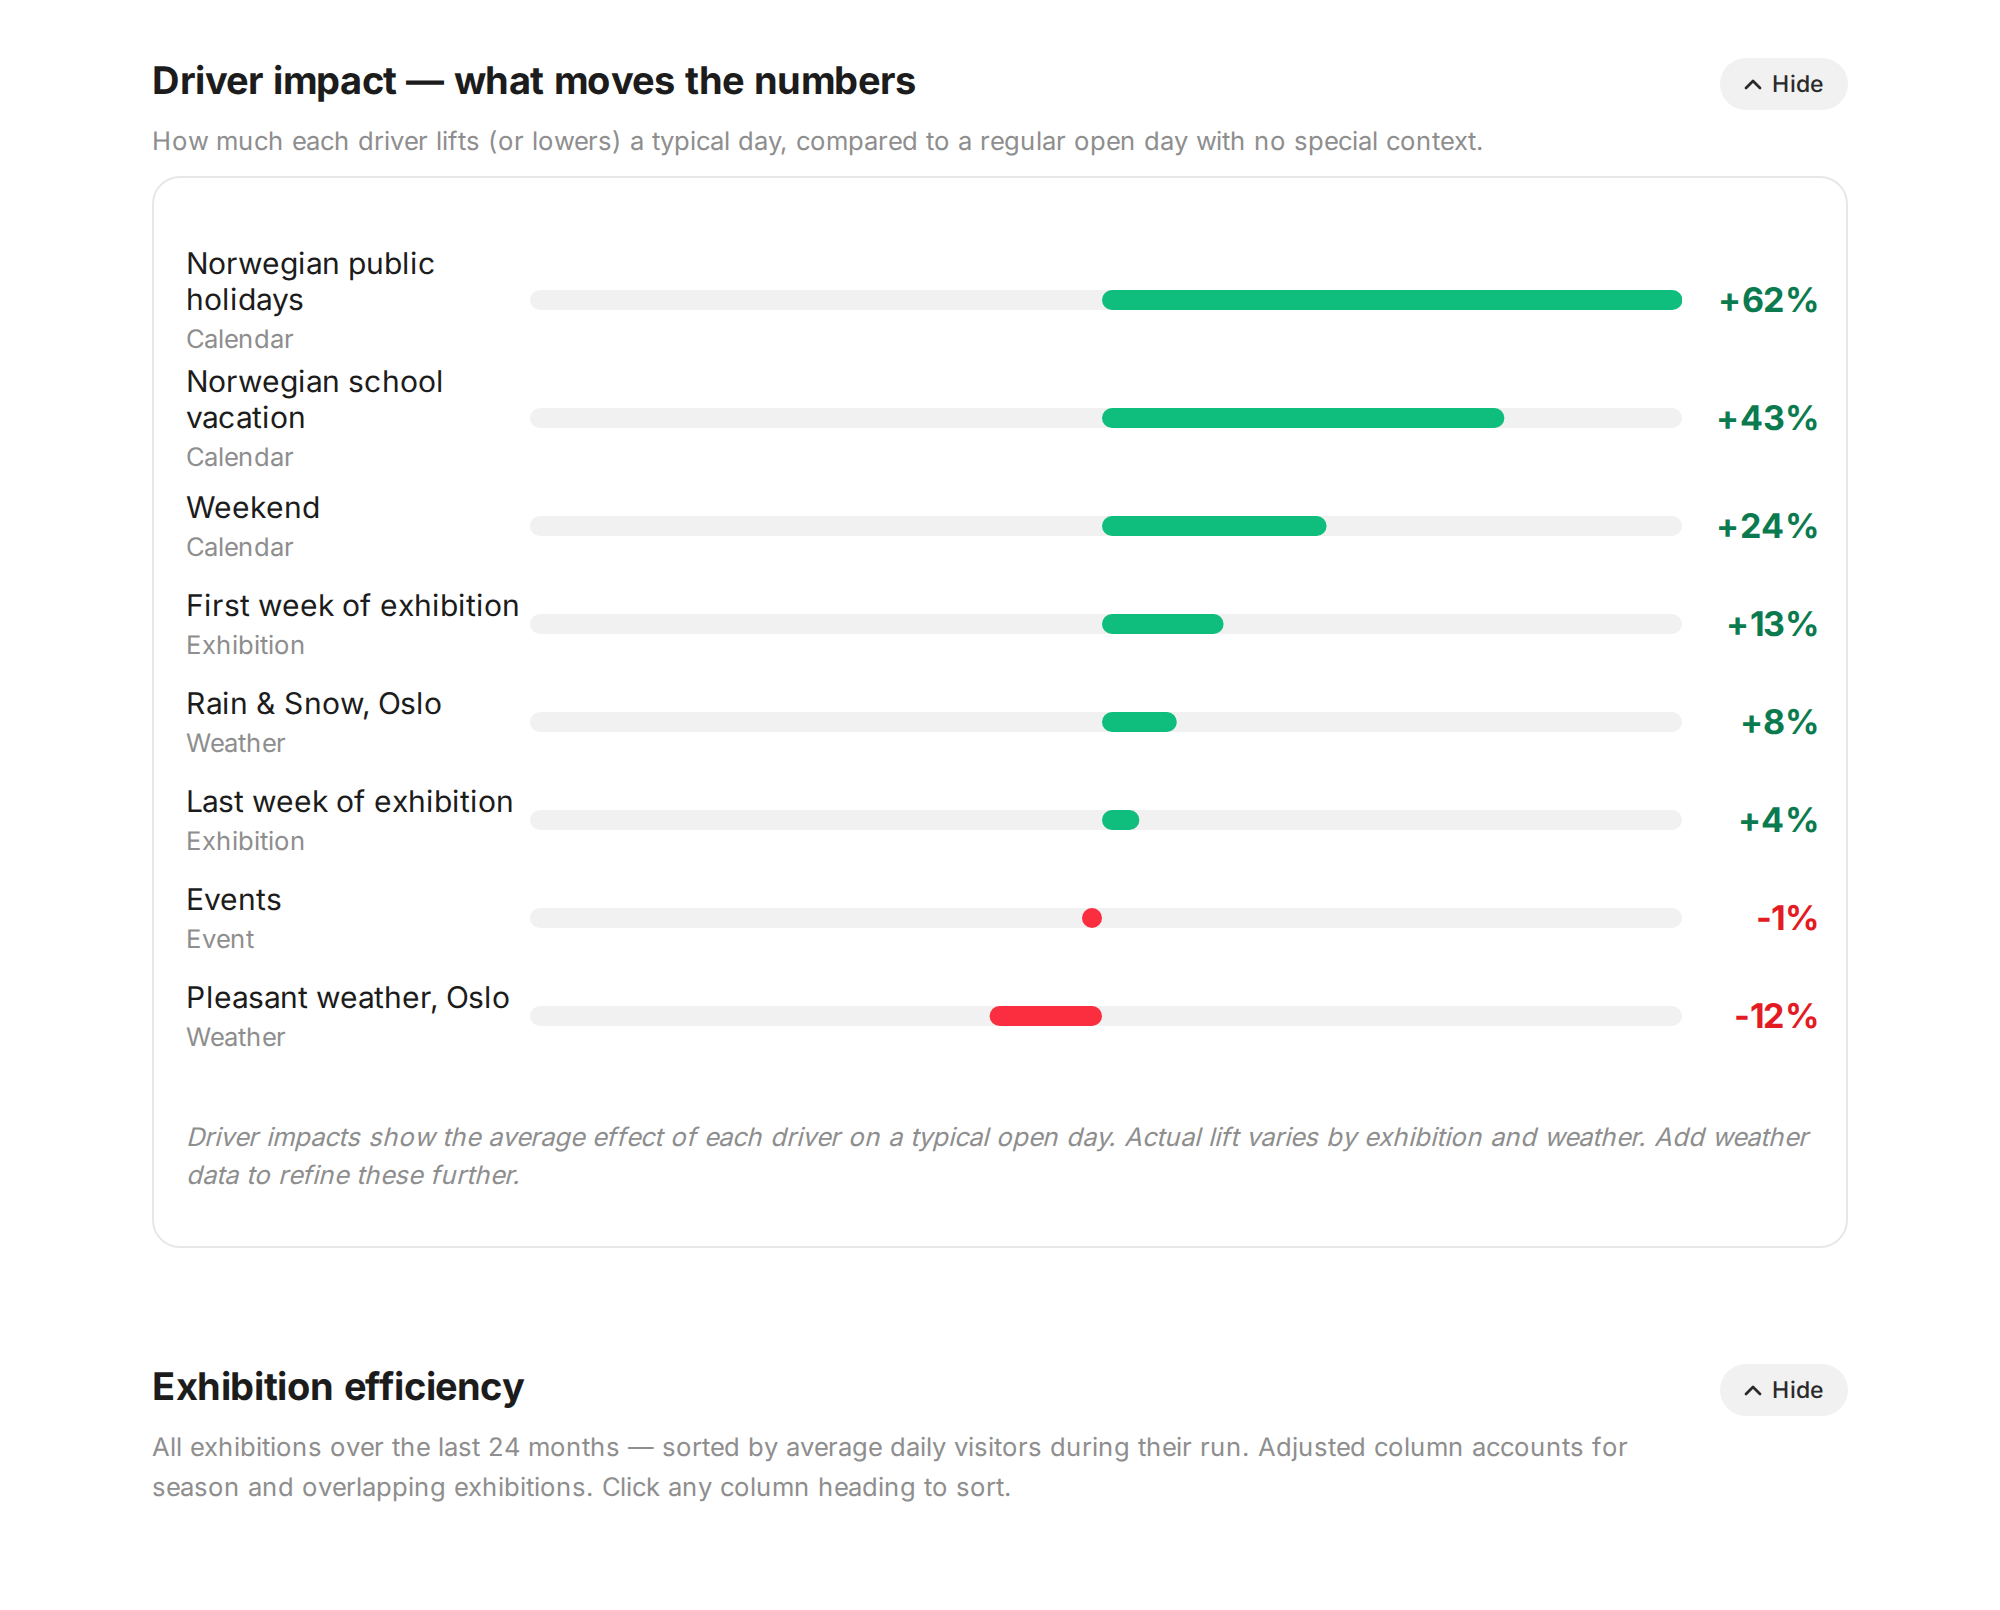
Driver impact
See how much school vacations, holidays, weekends, and other drivers lift a typical day at your museum.
Exhibition efficiency
Compare exhibitions on season-adjusted uplift, not raw visitor counts — so a show that opened in a quiet month gets a fair assessment, and the next exhibition decision is grounded in what actually worked.
The same drivers, projected forward
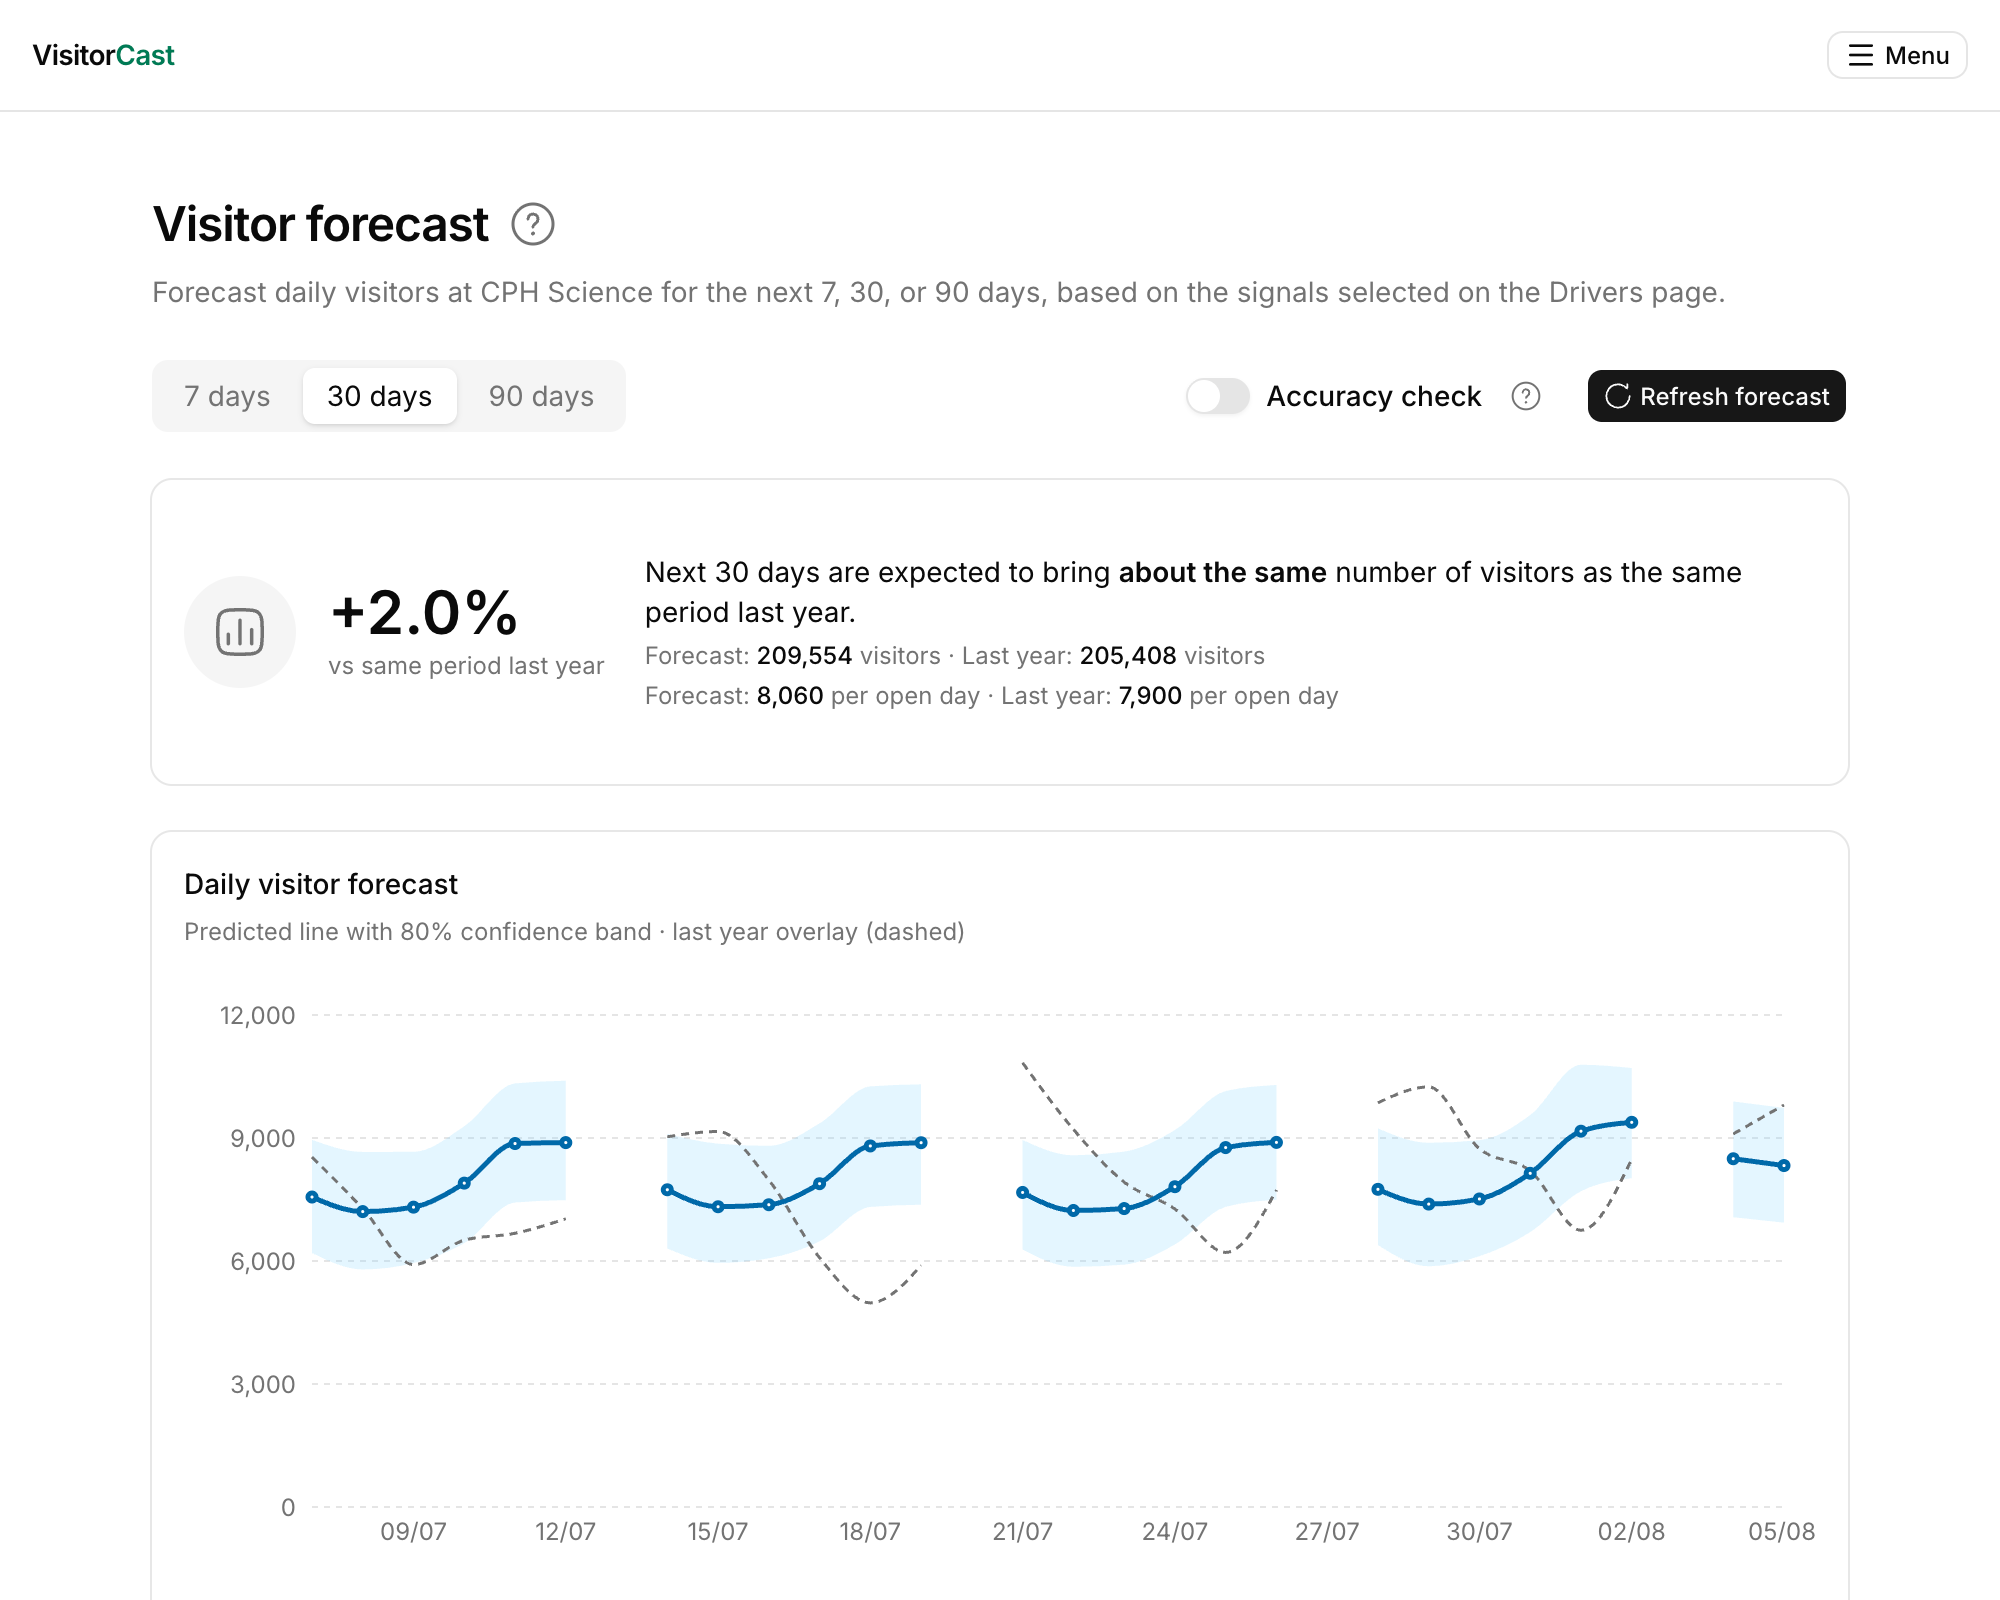
Once VisitorCast knows what moves your attendance, it forecasts your daily visitor numbers for the next week, month or quarter — with a confidence band instead of a single false-precision number, your own exhibitions and events already factored in, and last year overlaid for context.
Proof before you rely on it
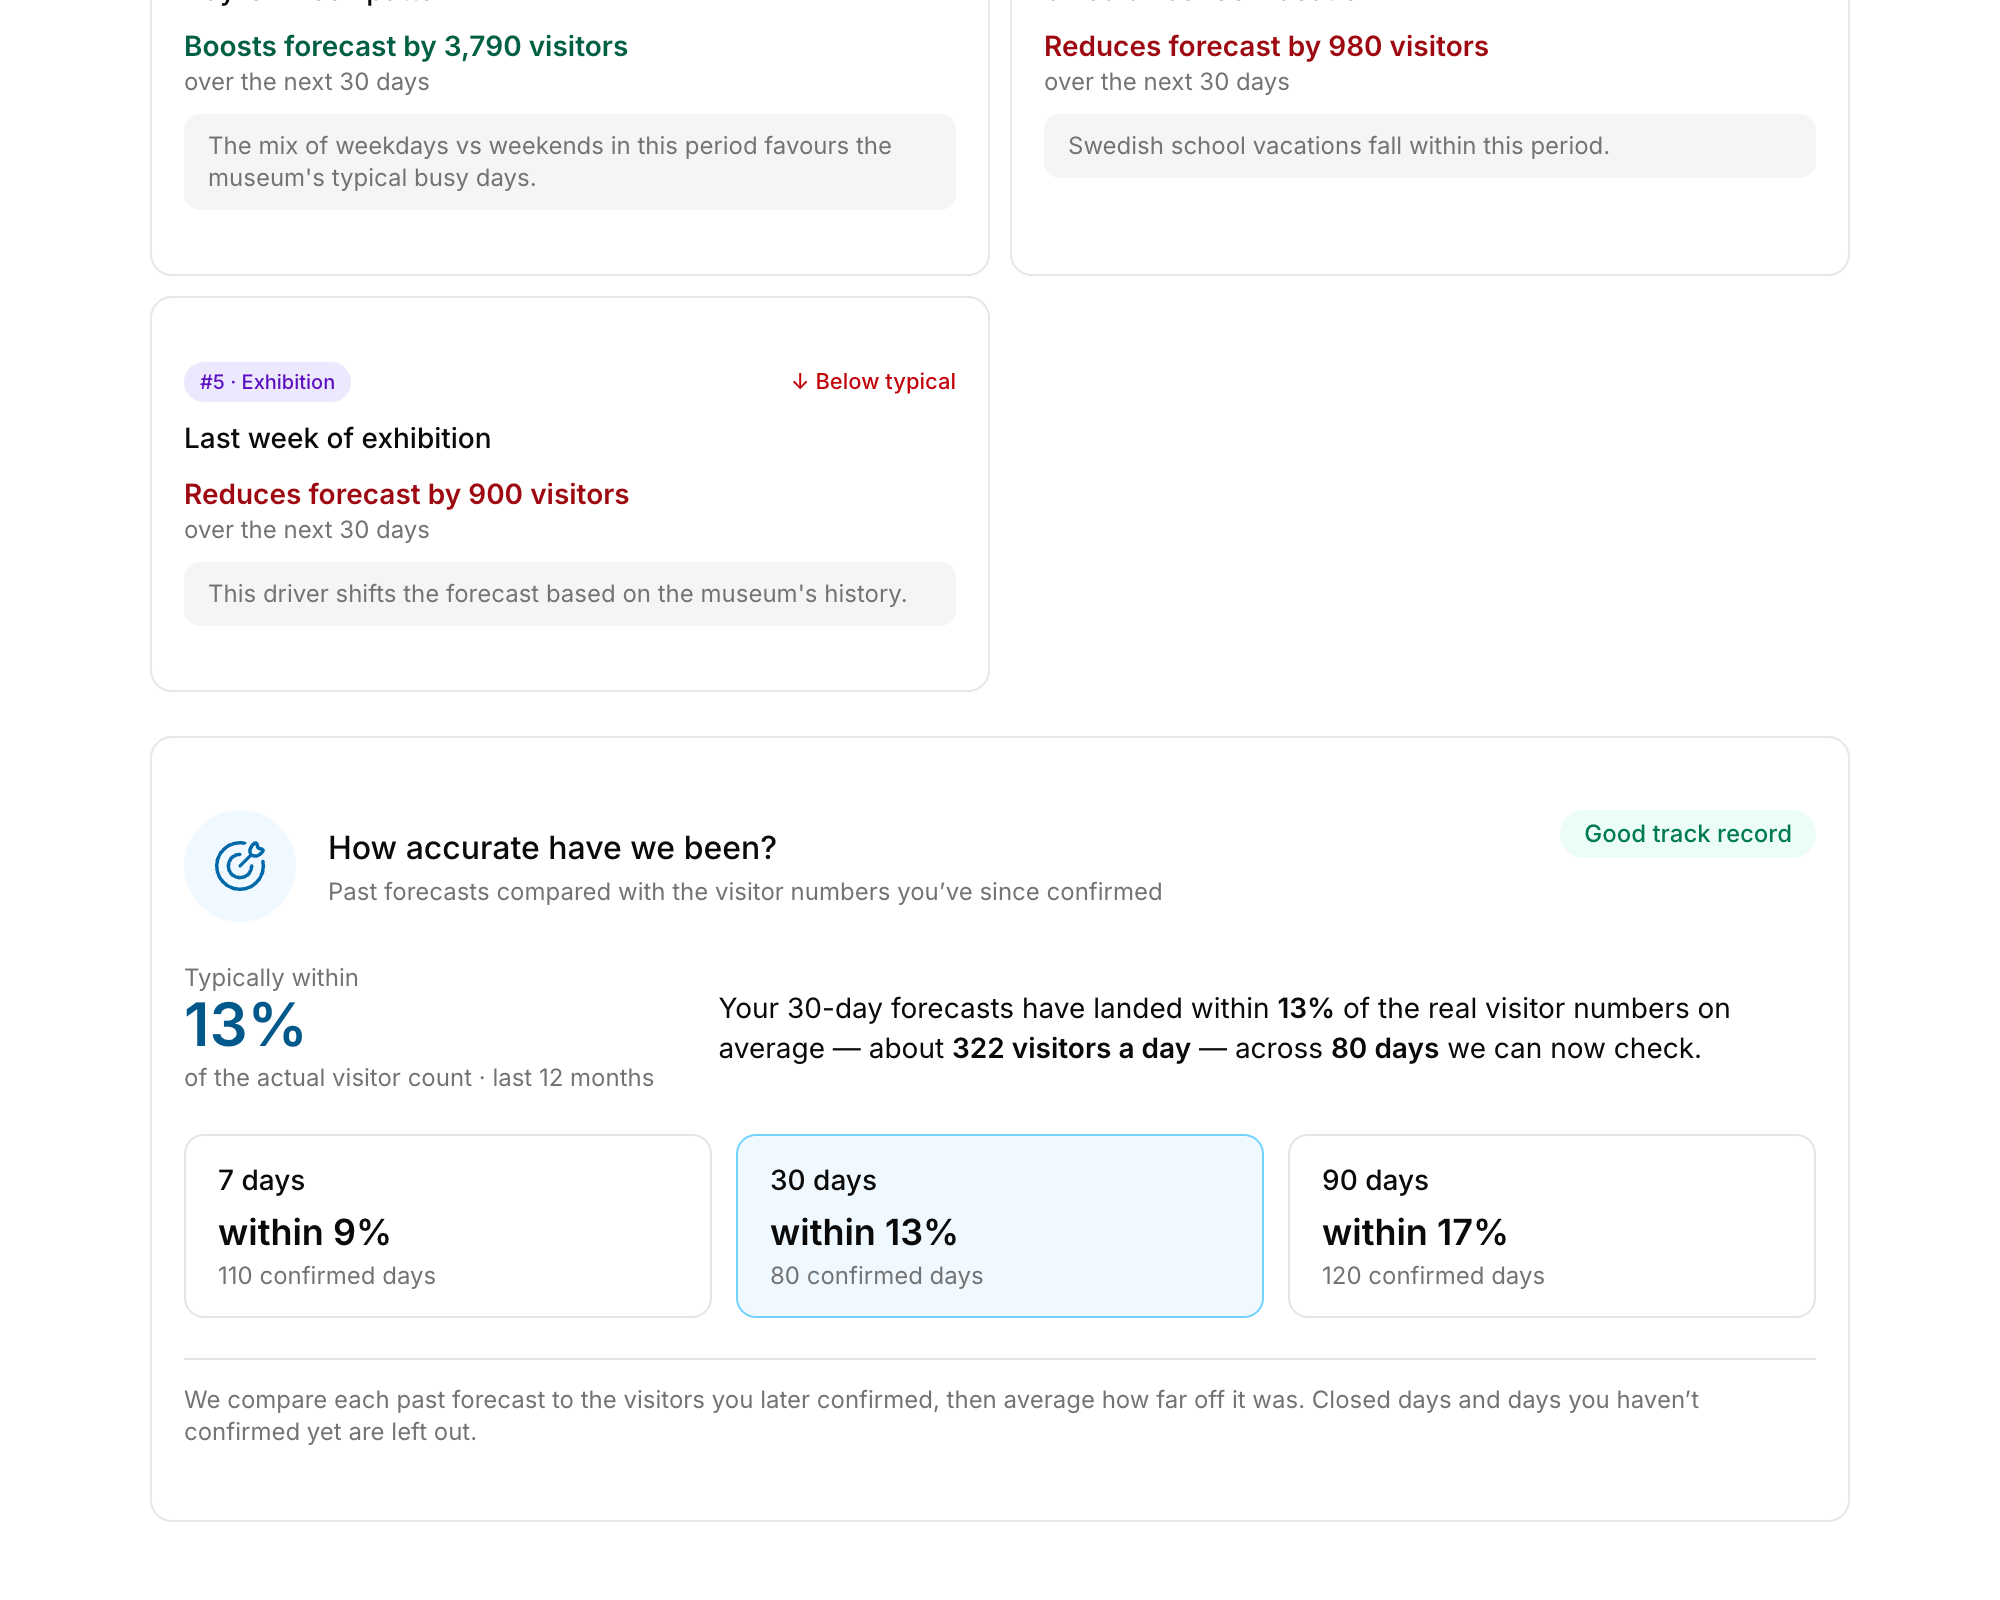
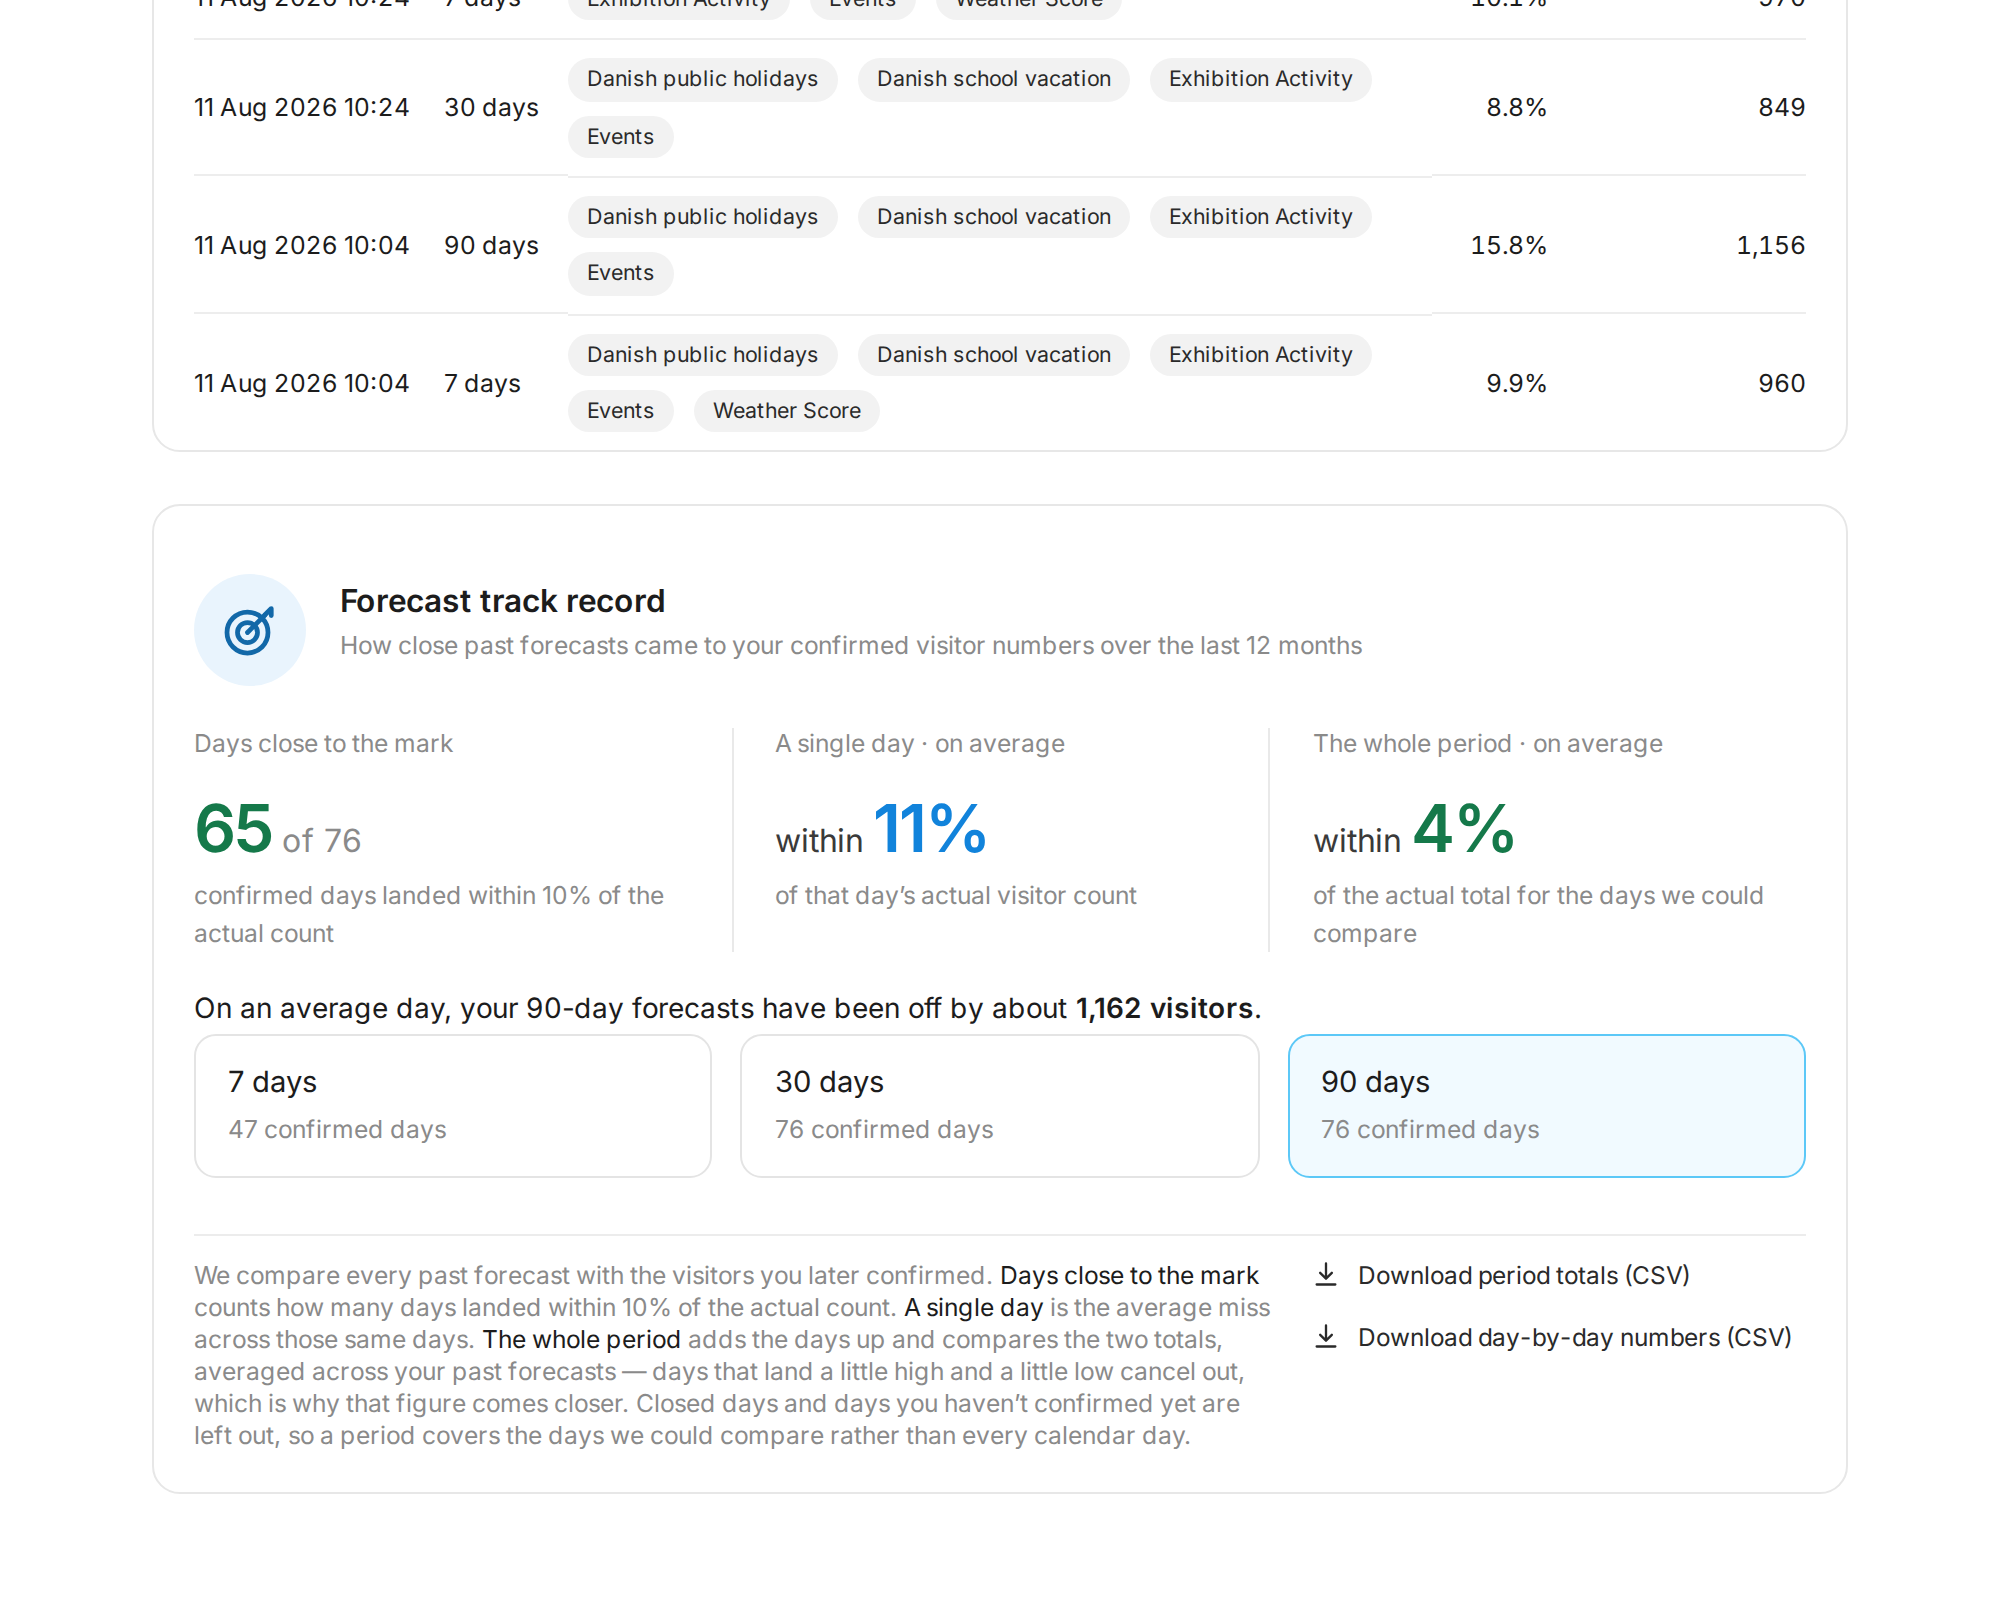
The accuracy check predicts a period that has already happened at your museum and puts forecast and actual side by side. You see how close VisitorCast would have been on your own data, before you plan anything around it — and once you are live, a running track record keeps score: days close to the mark, average day accuracy, and forecast versus actual for every period. Trust built on evidence, not promises.
A closer look
A few more of the views you get — click any to enlarge.
Why it matters
- Answers the question every director gets asked: why did the numbers change?
- Replaces manual status reports and internal spreadsheets — one source of truth for the whole team
- Saves hours of reporting work every month, with no analytics team required
- Ready for management and board meetings the moment you open it
- Turns your attendance history into decisions: staffing, opening hours, marketing timing, and exhibition planning
Learn how museum visitor analysis and forecasting work
Short, practical guides from the VisitorCast help centre — written for museum teams, not data scientists.
What is an accuracy check?
Learn how the accuracy check lets you test how well VisitorCast would have predicted a period that has already happened, so you can judge forecast accuracy for your museum.
Read the guide →How does VisitorCast predict museum visitor numbers?
How VisitorCast's prediction model works — a transparent, additive time series model built from trend, seasonality, and demand drivers, so you can see exactly what shapes your forecast.
Read the guide →How to get the best museum visitor forecasts
Improve your forecasts with clean historical data, accurate opening days, relevant drivers and consistent planning assumptions.
Read the guide →What are drivers, regressors and signals?
Understand the factors that explain why museum visitor numbers go up or down — and how VisitorCast uses them to improve forecasts.
Read the guide →Become a pilot museum
VisitorCast is a young product, built with museums, for museums — and already in daily use at our first museum partner. In 2026 we are onboarding a limited number of pilot museums. We keep the group small on purpose: every pilot museum gets real attention, and every pilot shapes what VisitorCast becomes.
Built for museums. Designed to be understood.
VisitorCast is built on a simple belief: a number is only useful if the people planning around it understand and trust it. That is why every figure comes with its drivers, why data quality is always visible, and why the accuracy is verifiable at every step — test it on your own history before you rely on it, and follow the live track record of forecast versus actual after. No hardware to install, no ticketing system to replace, no data team to hire, no black box to take on faith — just clear analysis and forecasts, in museum language, built only for museums, for the everyday decisions of directors, operations managers, visitor services, marketing, and finance teams.
See what your own data says
Book an online presentation and bring your visitor history. We'll show you what actually drove your attendance over the past years — and how well VisitorCast would have predicted a period that has already happened at your museum. Real analysis, and real forecast against real numbers, on your own data. No commitment, no data team required.
Contact VisitorCast — hello@visitorcast.com